INTERNATIONAL TRAINING ON DATA AND STATISTICAL ANALYSIS AND PRESENTATION
COURSE BACKGROUND
As governments, organizations, and communities across Africa strive to address complex environmental and development challenges, the demand for data-informed decisions has never been greater. From climate change adaptation and natural resource management to poverty reduction and governance reforms, reliable data and sound statistical analysis form the backbone of effective policy formulation, monitoring, and evaluation.
However, data is only powerful when it is properly collected, analyzed, interpreted, and communicated. Many professionals in policy and development fields face challenges in making sense of large data sets, selecting appropriate analytical methods, and presenting their findings in a way that influences decisions. This gap often leads to underutilized data, poorly communicated reports, or missed opportunities for impact.
To address these challenges, the Environmental Capacities and Sustainability Institute (ECAS) offers this course to build practical, hands-on skills in data analysis and presentation. The course is tailored for African practitioners working in government, NGOs, international agencies, and research institutions. It balances statistical theory with real-world applications, using relevant data sets related to environment, health, economics, and governance. It also emphasizes the ethical use of data and the importance of presenting complex results in a simple, clear, and visually engaging way for both technical and non-technical audiences.
Whether analyzing trends, evaluating program results, or preparing policy briefs, participants will leave this course equipped with the tools to turn data into action.
COURSE OBJECTIVES OF THE TRAINING
By the end of this course, participants will be able to:
- Understand foundational concepts in data types, sources, and collection methods.
- Clean, organize, and manage datasets using appropriate tools and techniques.
- Apply basic and intermediate statistical methods to analyze data relevant to environmental and development sectors.
- Interpret statistical outputs and translate them into clear, evidence-based insights.
- Design and present visual data stories using charts, graphs, and dashboards.
- Communicate findings effectively to inform policy decisions, reports, and stakeholder engagement.
- Use software tools such as Microsoft Excel, SPSS, or R for data analysis and visualization.
- Ensure ethical use of data, including transparency, accuracy, and respect for privacy.
WHAT YOU WILL LEARN
Participants will gain practical knowledge and skills to:
- Distinguish between quantitative and qualitative data
- Identify reliable sources of environmental and socio-economic data
- Perform data cleaning and basic statistical operations (e.g., mean, median, standard deviation)
- Conduct correlation, regression, and trend analysis
- Create impactful data visuals (e.g., bar charts, pie charts, time-series plots)
- Design data-driven reports and presentations for decision-makers
- Avoid common data misinterpretations and presentation errors
- Apply storytelling principles to turn complex findings into simple messages
DURATION AND PROGRAM
TARGET PARTICIPANTS
This course is designed for professionals who work with data to support policy-making, program evaluation, or advocacy in the fields of environment, governance, public health, agriculture, climate change, and sustainable development. It is ideal for government officials, monitoring and evaluation (M&E) officers, data analysts, researchers, NGO staff, and project managers who need to analyze, interpret, and present data effectively. The course is suitable for both technical and non-technical practitioners, including those with limited formal training in statistics, but who regularly engage with data for reporting, decision-making, or stakeholder communication.
TRAINING STYLE
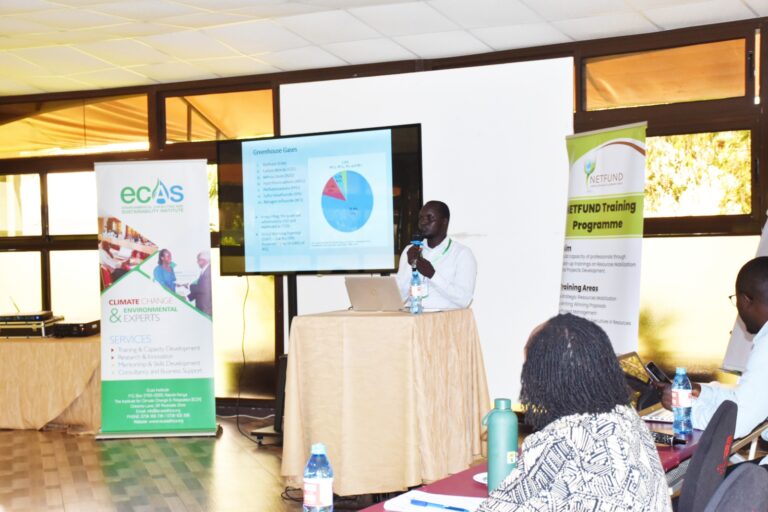
The modules will be taught through PowerPoint presentations, and lectures and will include a case study/field visit, breakout sessions, case studies and other interactive discussion components.
The course will also include a few guest speakers, both in person and via Zoom and other online learning platforms for overseas speakers. This provides useful real-world insights alongside the more theoretical aspects of the course.
The conference faculty shall consist of experienced decision makers, as well as practitioners and representatives from established educational and research institutions active around climate change, engineering and international development. Throughout the course, theoretical presentation of concepts will be moderated and more group discussions and plenary engagements will be optimized. PowerPoint presentations will be made by facilitators and resource persons, to highlight key concepts before embarking on group work.
TRAINING MODULES
| No | Module | Details | |
| 1. | Understanding Data and Its Role in Decision-Making |
This module sets the foundation by exploring what data is, where it comes from, and how it informs policy and development decisions.
Key Topics:
|
|
| 2. | Data Collection, Cleaning, and Preparation |
Before analysis, data must be organized and cleaned. This module teaches practical steps for preparing datasets for meaningful analysis.
Key Topics:
|
|
| 3. | Introduction to Statistical Analysis |
This module introduces key statistical concepts and techniques used to summarize and interpret data.
Key Topics:
|
|
| 4. | Exploring Trends and Relationships in Data |
Learn how to uncover patterns and relationships in your data using basic analytical techniques.
Key Topics:
|
|
|
5.
|
Data Visualization and Presentation |
Visuals help make data more accessible and impactful. This module focuses on how to tell stories with data using visuals.
Key Topics:
|
|
| 6. | Communicating Statistical Findings to Non-Technical Audiences |
Data is only useful if people understand it. This module helps participants translate analysis into simple, clear, and actionable messages.
Key Topics:
|
|
| 7. | Practical Application and Project Work |
Participants will apply all their learning by working on a mini data project using real or simulated datasets.
Key Topics:
|
|
9. GENERAL NOTES
- Training manuals and additional reference materials are provided to the participants.
- Upon successful completion of this course, participants will be issued with a certificate.
- We can also do this as a tailor-made course to meet organization-wide needs. Contact us to find out more: info@ecasiafrica.org.
- Payment should be sent to our bank account before the start of training and proof of payment sent to: info@ecasiafrica.org.
ABOUT ECAS INSTITUTE
The ECAS Institute designs and delivers independent and targeted training, research, and consulting services. Our work focusses on climate change and resilience building, carbon markets, renewable energy, nature-based solution, biodiversity conservation, agriculture and food systems, We are located in Nairobi Kenya and work across the African region. We have implemented training and research assignments in Kenya, Tanzania, Uganda, South Sudan, Somalia, Malawi, Rwanda, Congo, and South Africa. Globally, we have supported our partners from the UK, Denmark, Italy, Sweden, Germany, and USA.
